Comparing sector returns since the beginning of the Covid-19 pandemic
One sector made the lowest lows from pre-pandemic levels... and also the highest highs
I built my first interactive web app and got all geared up to share it here on Substack, only to discover that Substack offers no way to embed it! Madness. Well, I offer a couple sample outputs below, but if you’d like to play with the interactive version, you can just click here to view it on the web.
Equal-weight strategies have outperformed
The interactive web app offers a couple different ways to slice the data: either by equal-weighted returns or market-weighted returns.
As you can see from the plots below, there’s not a huge difference between the two, but equal weighting has tended to exaggerate sector performance since the appearance of Covid-19. Underperforming sectors underperformed a bit more in an equal-weighted strategy, and overperforming sectors overperformed a bit more.
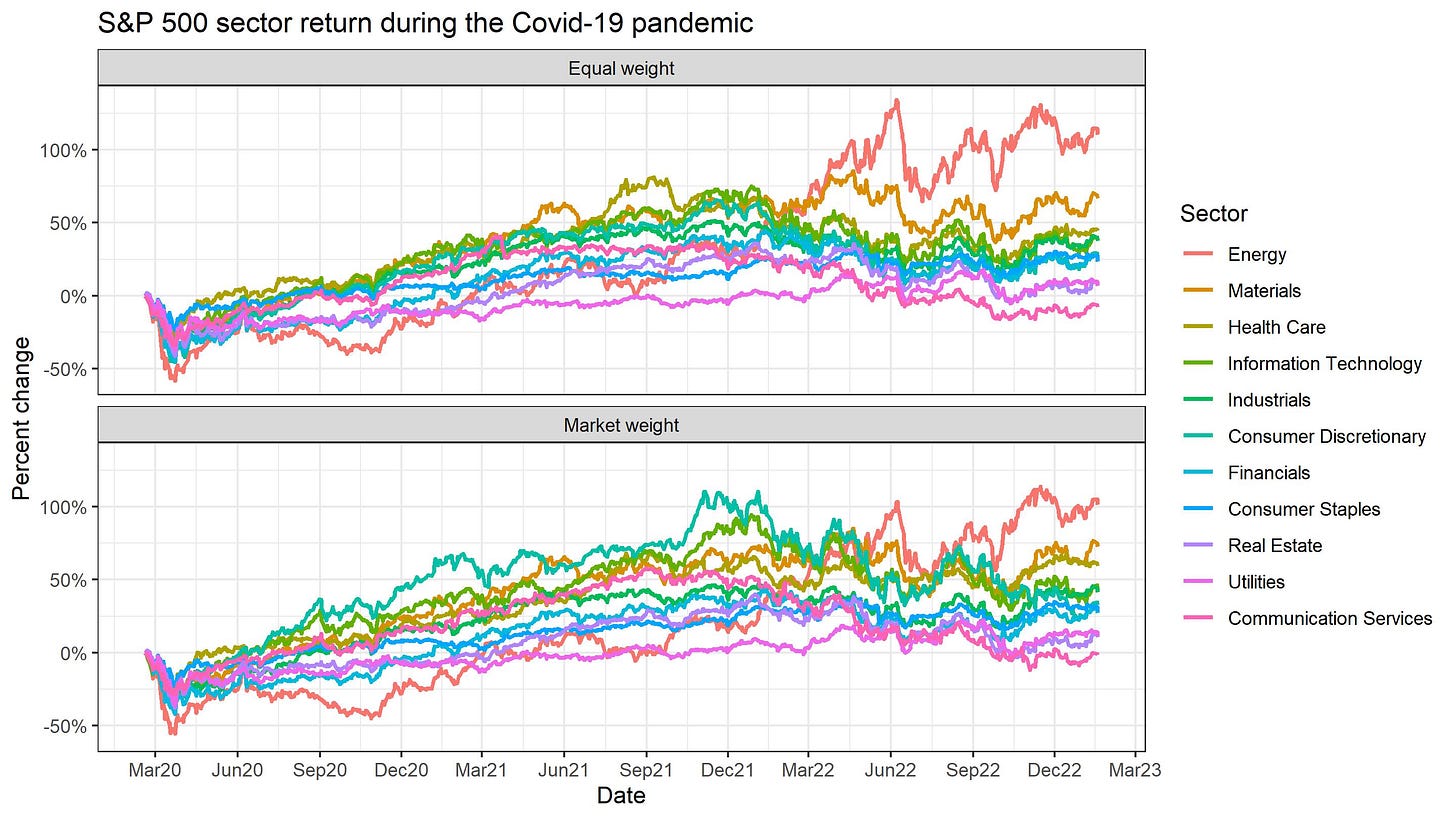


Overall, it’s been a good few years for equal-weighted strategies, mostly because we’re coming out of a bit of a decade-long large-cap bubble. Mega-firms continue to have advantages of technology and scale, but recently we’ve seen that they also suffer from bloat and institutional inertia.
Just look at how OpenAI’s agility as a small firm has allowed it to outcompete Google in AI for end consumers. Google reportedly has better AI models, but for legal and PR reasons, it has been reluctant to bring a product to market. OpenAI, meanwhile, just went for it, and has dominated the market as a result.
The big tech conglomerates are also recently discovering that they hired way too many people over the last few years.
Energy is the counterintuitive Covid winner, and communications the loser
Another feature of the interactive web app is that you can check or uncheck the various sectors to include or exclude them from the chart. For instance, let’s keep just the top two and the bottom three sectors on the chart:
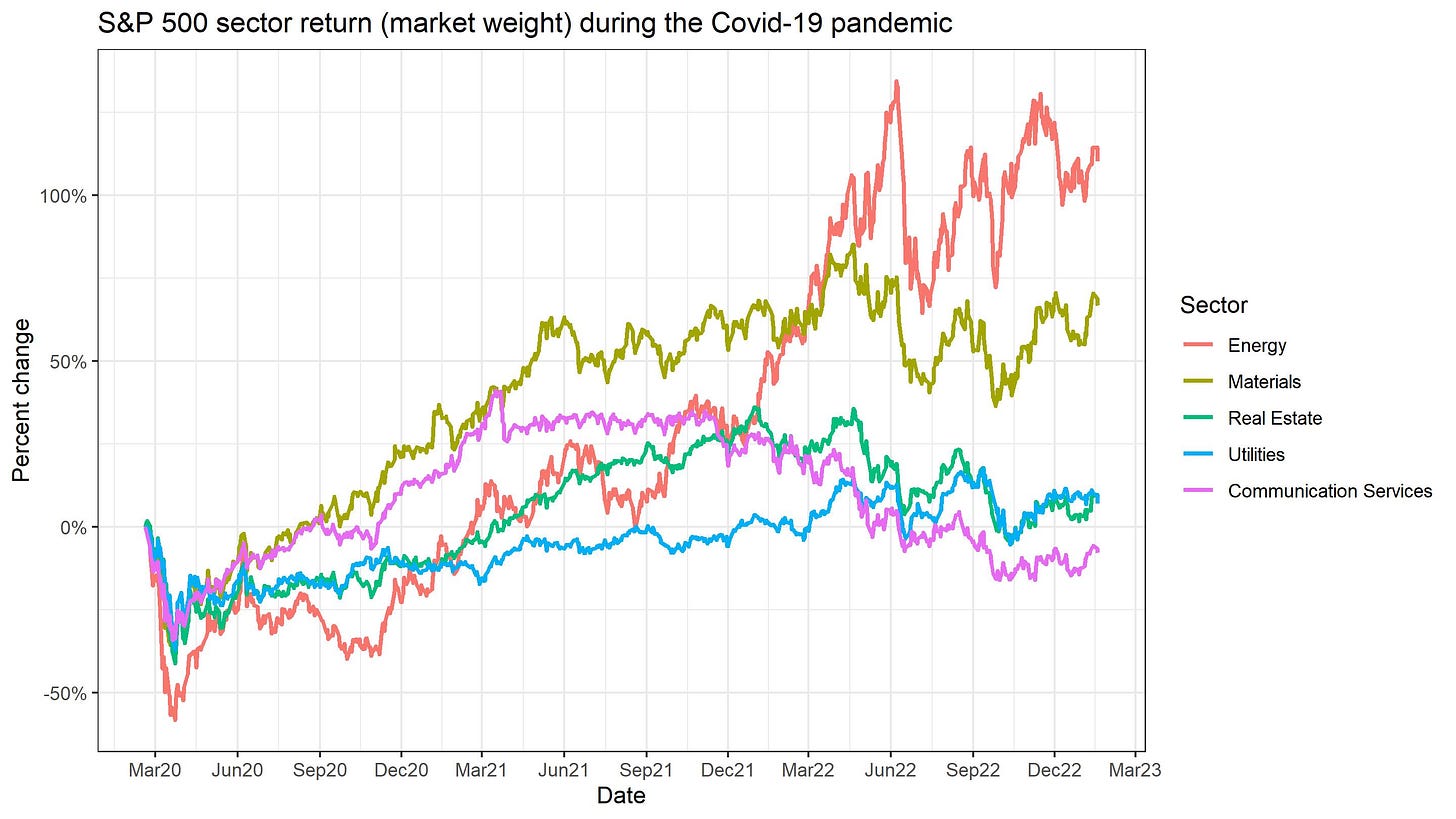
The results, I have to say, are counterintuitive. One of the big narratives out of the Covid-19 pandemic was that the pandemic accelerated shifts toward telecommuting and work-from-home. So how can it be that the one sector with negative returns from pre-pandemic levels is the Communication Services sector? The traditionally defensive Real Estate and Utilities sectors have also underperformed—not what you would expect in a pandemic, although the collapse of Real Estate demand makes sense with commercial storefront closures.
The outperformance of Energy is unexpected, as well. Covid-19 heavily impacted the transportation industry, reducing demand for passenger air and sea travel. You’d think that this would have killed fuel demand. And indeed, Energy was the hardest-hit sector in the early days of the pandemic, with a dramatic >50% plunge. But the sector came roaring back to also make, by far, the highest highs from pre-pandemic levels. As of today, the sector is up over 100%, no matter how you weight the index. The second-place performance of the Materials sector makes a bit more sense, given how the pandemic shifted demand from services to physical goods.
To some extent, this counterintuitive sector performance is related to underlying structural issues in the respective sectors that had nothing to do with the pandemic. The Communication Services sector had gotten a little oversaturated after a decade of strong performance, and the Energy sector had gotten pretty underinvested after a decade-long lag. Thus, we ended up oversupplied with Communications Services and undersupplied with Energy.
And then there’s the odd way that the pandemic “pulled forward” Communications Services demand and deferred Energy demand into the future, which exaggerated the underlying supply dynamics. Communications Services firms overinvested during the pandemic, with massive hiring. Energy firms underinvested and underproduced, shuttering lots of oil wells because prices were down. When the country opened back up with trillions of dollars of stimulus burning holes in people’s pockets, Communications Services revenue growth went negative, and there just wasn’t enough Energy to go around.
I suspect things will start to normalize as we move forward from here. Mind you, Energy and Materials may stay hot for a while, because there’s a war on, the sectors are still underinvested, and inventories are low. Oil and gas firms have been reluctant to drill new wells, because so many governments are working on phasing out fossil fuels. But central banks are working on killing demand by raising interest rates, and hopefully new technological developments in renewables, energy storage, and grid balancing will help calm things down. Meanwhile, Communications Services firms are tightening their belts and starting to adjust their strategies to make themselves more competitive in the future, so I suspect we’ll see them return to cash flow growth.
Bibliography
Dancho M, Vaughan D (2022). tidyquant: Tidy Quantitative Financial Analysis_. R package version 1.0.6. https://CRAN.R-project.org/package=tidyquant.
R Core Team (2022). R: A language and environment for statistical computing. R Foundation for Statistical Computing, Vienna, Austria. https://www.R-project.org/.
Wickham H, et al. (2019). “Welcome to the tidyverse.” Journal of Open Source Software, 4(43), 1686. https://doi.org/10.21105/joss.01686.
Code for Shiny app: Github
Code to scrape data: Github


